The VIX Is Not a Crystal Ball. It Is Mostly an Expensive Weather Forecast.
I tested more than three decades of VIX forecasts against what the S&P 500 actually did. The VIX predicts volatility, overstates the usual move, and offers almost no directional edge.
The VIX is often called the market’s fear gauge.
This is catchy, intuitive, and just vague enough to survive almost any chart on financial television.
But the VIX is not actually a mood ring for equities. It is a market-implied estimate of S&P 500 volatility over the next 30 calendar days. That gives us a much less dramatic—and much more testable—question:
When the VIX says a certain amount of movement is coming, how much movement actually arrives?
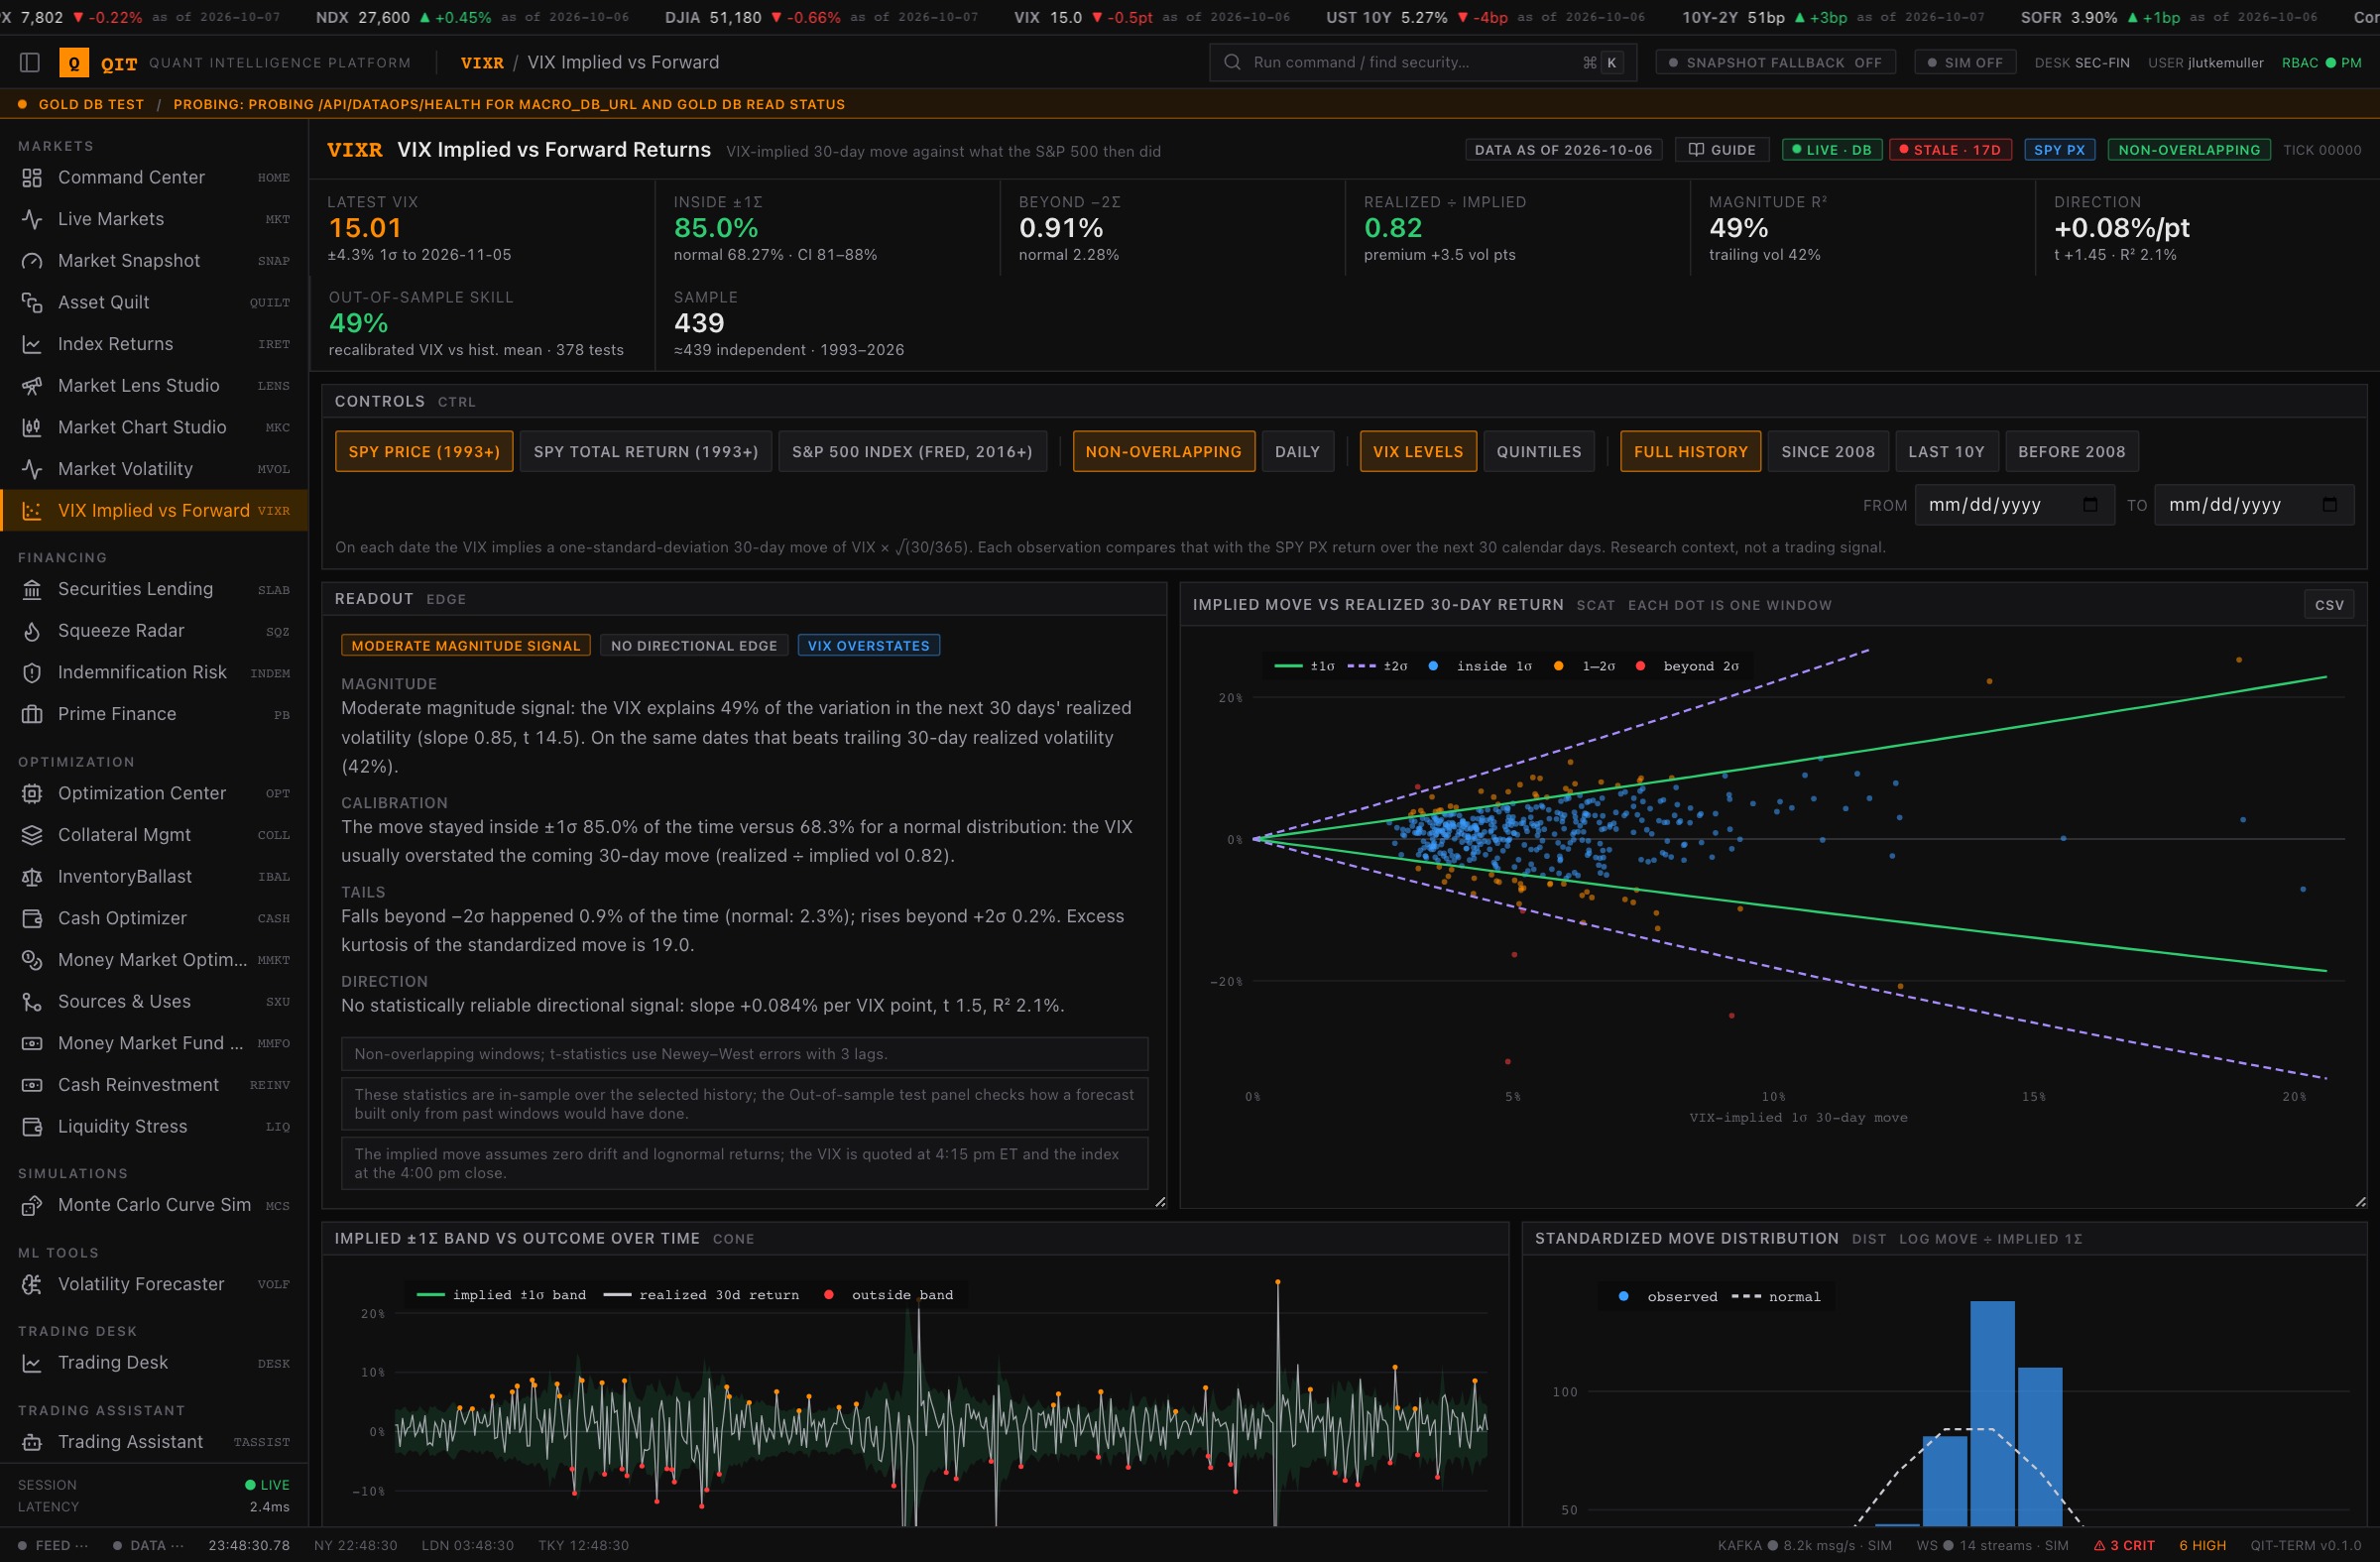
I built the VIX Implied vs Forward Returns module, or VIXR, to answer that question using VIX and SPY history from 1993 through October 6, 2026.
The short version is delightfully inconvenient for anyone selling a simple market narrative:
- The VIX is useful for forecasting the magnitude of volatility.
- The raw VIX usually forecasts more volatility than subsequently arrives.
- The VIX is basically useless for forecasting the direction of returns.
So yes, the VIX knows something about the weather.
It does not know whether the market will walk north or south in the rain.
The screenshots below come directly from VIXR inside QuantMeridian, using Gold VIX and SPY data through October 6, 2026. The tasteful quantity of black is how you know a terminal means business.
What VIXR actually tests
For every trading day with both a VIX close and an S&P 500 price, VIXR converts the annualized VIX into a 30-day, one-standard-deviation move:
\[\sigma_{30} = \mathrm{VIX} \sqrt{\frac{30}{365}}\]A VIX of 20 therefore implies a 30-day log move of about 5.7% in either direction.
The module then looks 30 calendar days ahead, finds the last available trading close on or before that target date, and records what happened. From there it asks three separate questions that people frequently mash together into one confident sentence:
- Calibration: Did the market stay inside the implied range as often as it should?
- Magnitude: Did a higher VIX predict higher realized volatility?
- Direction: Did a higher VIX predict a positive or negative return?
Those are different claims. A thermometer can tell you tomorrow will be unusually hot without knowing whether you will enjoy the picnic.
The headline results
The cleanest read uses non-overlapping 30-day windows, which avoids pretending that 21 heavily shared daily returns are 21 fresh revelations from the universe.
| Finding | VIXR result |
|---|---|
| Non-overlapping windows | 439 |
| Forward moves inside the implied ±1σ band | 85.0% |
| Normal-distribution benchmark for ±1σ | 68.27% |
| Forward moves inside the implied ±2σ band | 98.9% |
| Realized volatility ÷ implied volatility | 0.82 |
| Average VIX premium over subsequent realized volatility | 3.5 vol points |
| Windows where VIX exceeded subsequent realized volatility | 83% |
| In-sample realized-volatility R² | 49% |
| Trailing-volatility R² on comparable dates | 42% |
| Directional return R² | 2.1% |
Daily sampling tells almost the same story: 83.5% inside ±1σ, a realized-to-implied ratio of 0.81, magnitude R² of 52%, and directional R² of 1.0%.
That agreement matters. Changing the sampling method does not suddenly turn the VIX into an oracle. Very inconsiderate of the data.
Finding one: the VIX is usually too wide
If the implied one-standard-deviation band behaved like a perfectly calibrated normal forecast, about 68.3% of forward moves would land inside it.
VIXR finds 85.0%.
That is not a rounding error. It means the VIX-implied range was wider than the move that arrived far more often than a textbook normal model would suggest. Realized volatility averaged only 82% of implied volatility, and the VIX finished above subsequent realized volatility in 83% of the non-overlapping windows.
This is the variance risk premium showing up in plain clothes. Buyers of protection generally paid for more volatility than the market delivered. That is not necessarily irrational: insurance is allowed to cost more than the expected claim. Apparently tail risk does not accept payment in exposure-adjusted goodwill.
The practical implication is that treating the raw VIX as an exact sizing forecast will usually produce a band that is too wide. It is informative, but biased upward.
That distinction matters. “Biased” does not mean “useless.” A bathroom scale that is always five pounds heavy can still track whether your weight is rising. It just should not be allowed to write the medical report without calibration.
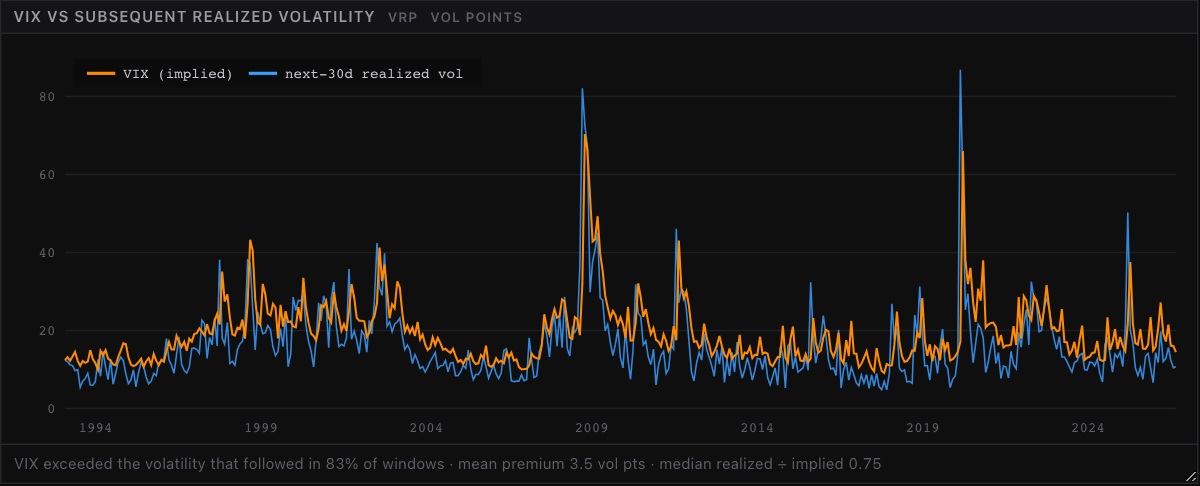 The volatility-risk premium in one picture: VIX exceeded the volatility that followed in 83% of non-overlapping windows, with a mean premium of 3.5 vol points.
Finding two: the VIX genuinely forecasts volatility
The more interesting result is that VIX is not merely expensive noise.
In the full non-overlapping sample, a regression of next-month realized volatility on the starting VIX produced an R² of 49%. With daily windows, it reached 52%. The estimated slopes were positive and statistically strong.
For comparison, trailing 30-day realized volatility explained about 42% of the next month’s realized volatility on the same dates.
So the options market’s forward-looking price contained more information than simply assuming next month would resemble last month. Sometimes markets do process information. Please remain calm.
Still, the fit was not evenly distributed through history. Much of the out-of-sample advantage came from 2008 and 2020, when a historical average was spectacularly unprepared for a volatility spike. The VIX was not perfect in those episodes, but “less wrong than the long-run mean during a crisis” is valuable when the alternative forecast has wandered off to admire its own stability.
Finding three: calibration improves the forecast
An in-sample regression can look excellent while quietly memorizing the past, so VIXR also runs an expanding-window test.
For each test date, the model is fitted only on windows that had completely finished before that date. No open 30-day window enters the training set. No future outcome sneaks backward through a convenient join. The model must make its forecast using only information that would have existed at the time—which is apparently a controversial design choice in some backtests.
Across 378 non-overlapping test windows from 1997 through 2026:
| Forecast | Out-of-sample volatility skill vs. historical mean |
|---|---|
| VIX as quoted | 37% |
| VIX recalibrated | 49% |
| Trailing 30-day volatility | 32% |
The recalibrated VIX recorded an RMSE of 7.46 vol points, compared with 8.60 for trailing volatility. The Diebold–Mariano statistic was −2.9, indicating a significantly smaller squared forecast error for the recalibrated VIX under the test used by the module.
Daily sampling delivered a similar result: 51% skill for the recalibrated VIX versus 31% for trailing volatility, with RMSE of 7.07 versus 8.37 and a Diebold–Mariano statistic of −3.2.
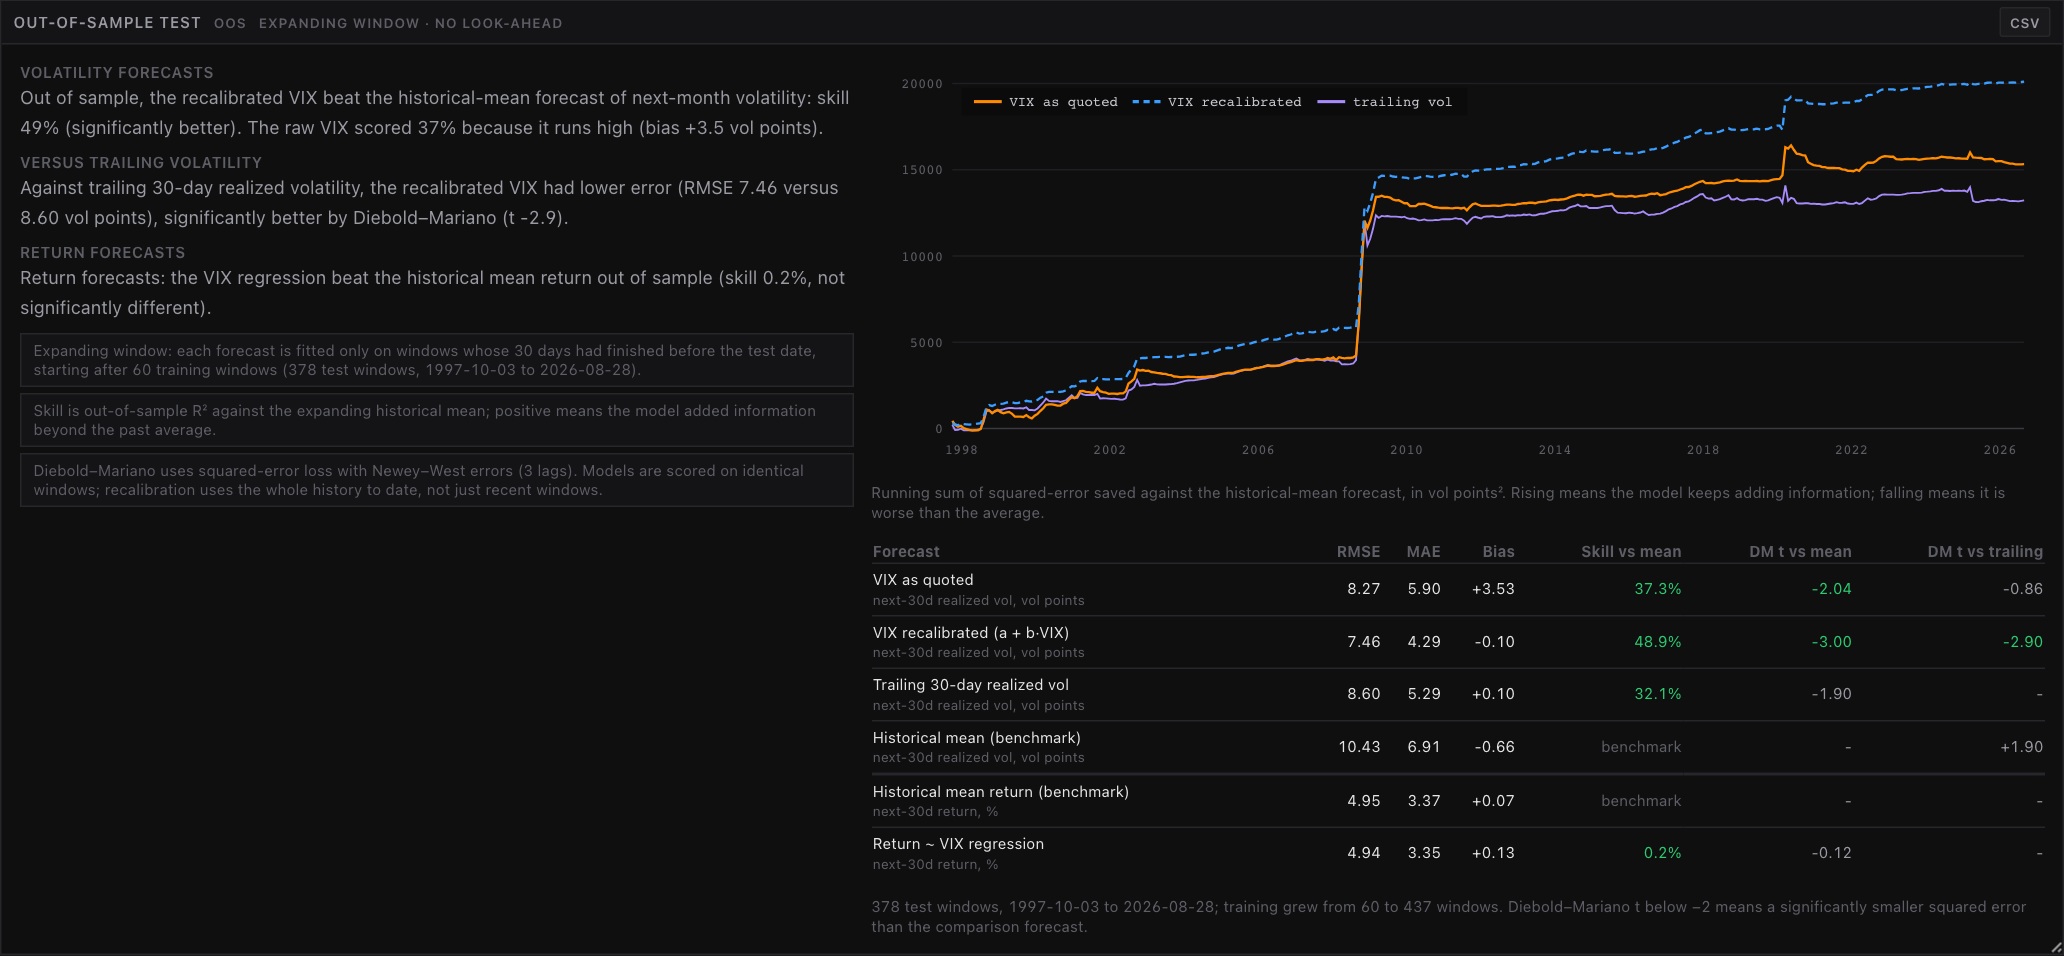 The module’s no-look-ahead test. The large 2008 step is a useful reminder that a volatility forecast can earn much of its keep precisely when a historical average is busy being historically average.
The lesson is refreshingly boring: the VIX contains useful forward information, and a simple historical recalibration makes it better.
Not an AI ensemble. Not a 74-factor alternative-data pipeline. A line with an intercept.
Finance will survive somehow.
Finding four: high VIX is not a buy signal
The seductive story goes like this:
High VIX means fear. Fear means capitulation. Capitulation means buy.
It is a nice story. It even works often enough in memorable crisis rebounds to become a chart with a red circle and a large arrow.
The full-history results are less cooperative.
In non-overlapping windows, each additional VIX point was associated with a +0.084% higher 30-day return. But the Newey–West t-statistic was only 1.5, below the module’s threshold for a reliable directional tilt, and the regression explained just 2.1% of return variation.
With daily windows, the slope was +0.056%, the t-statistic was 1.6, and R² fell to 1.0%.
Most importantly, the expanding-window return model delivered only +0.2% out-of-sample skill with non-overlapping data and −0.9% with daily data. Neither result was statistically significant.
In other words, VIX may tell you that the next month will be eventful. It does not reliably tell you who wins the event.
This is why a bucket table showing strong average returns after very high VIX readings deserves suspicion. The highest-VIX observations are scarce, clustered in crises, and often followed by violent rebounds. A few extraordinary episodes can make an average look like a trading rule wearing a borrowed lab coat.
What surprised me
The most surprising result was not that implied volatility carried a premium. Options traders have been aware of insurance pricing for at least several minutes.
It was how cleanly the three interpretations separated:
- As a range: raw VIX was conservative.
- As a volatility ranker: VIX was useful.
- As a directional signal: VIX contributed almost nothing.
That separation is useful well beyond this module. Many market indicators fail because people ask them to perform a job they were never designed to do. Credit spreads can price stress without timing the equity bottom. Yield curves can describe macro expectations without naming next quarter’s winning sector. The VIX can forecast the size of the storm without providing turn-by-turn directions to the shelter.
How I tried to keep the experiment honest
VIXR uses both daily and non-overlapping samples. Daily windows preserve detail but overlap heavily, so the inference uses Newey–West standard errors and an effective sample size of roughly the number of observations divided by 21. Non-overlapping windows sacrifice sample size for cleaner independence.
The module also compares VIX against trailing volatility on identical dates, reports Wilson confidence intervals for calibration shares, and exposes the full window, bucket, and walk-forward data as CSV files.
For validation, I wrote exact-case and edge-case tests, simulated markets with known volatility, and an independent Python reference implementation using NumPy and SciPy. That reference recomputes the statistics with separate windowing, regression, and walk-forward logic, then checks the TypeScript engine against real-data excerpts from the 2007–2009 crisis and the calm market of 2017.
Duplicating the calculation independently is less exciting than announcing a breakthrough on social media, but it has the advantage of occasionally catching mistakes.
What the result does not prove
This is not a trading strategy.
The study does not include transaction costs, option surfaces, skew, term structure, position sizing, margin, or the charming experience of maintaining a short-volatility position while the market discovers a new historical event.
A persistent gap between implied and realized volatility is not the same thing as an easy profit. The premium may compensate sellers for negative skew, crash exposure, path dependency, liquidity stress, and the small operational detail that losses can arrive much faster than long-run averages.
The results also depend heavily on a few crises. The long-history series uses SPY price as a proxy for the S&P 500 index, and the recalibration is expanding rather than based on a rolling recent regime. Different horizons would require other VIX indices or the volatility term structure.
So the honest conclusion is narrower than “sell volatility” or “buy fear.” It is also more useful:
The VIX is a meaningful but systematically high forecast of near-term realized volatility. Recalibration improves it. Its level does not provide a reliable forecast of market direction.
The practical takeaway
I would use the VIX as an input to risk sizing, scenario ranges, hedge discussions, and volatility forecasts—but not as a standalone market-timing signal.
If the VIX jumps, the evidence supports saying:
“The distribution of likely moves has widened.”
It does not support saying:
“The market is scared, therefore stocks go up next.”
One is a volatility statement.
The other is a bedtime story for a position you already wanted to own.
The VIX is not a crystal ball. It is an expensive weather forecast: biased toward storms, genuinely useful when conditions change, and entirely capable of warning you about heavy rain without telling you which direction to drive.
Sources and reproducibility
- QuantMeridian, VIXR white paper and business guide. Methodology, reference results, assumptions, validation, and limitations.
- QuantMeridian, VIXR calculation engine and expanding-window test.
- QuantMeridian, independent Python reference implementation.
- Cboe, VIX methodology.
- Federal Reserve Bank of St. Louis, CBOE Volatility Index: VIX.
All headline statistics in this post use SPY price and the full available history through October 6, 2026. The module is research context, not investment advice and not a signal to sell insurance during the next crisis because a table looked reassuring.